

Reporting.
What did that word evoke in you? Dread? Anxiety? A need for a nap?
Most of us want data to inform our actions. We don’t want to waste money or time on something that we can’t prove worked or didn’t work.
But if you’ve ever been in charge of gathering and building that oh-so-necessary report, you know the pain of navigating to multiple data sources, waiting a billion years for them to load, and then accidentally closing the tab over and over again (you know you’ve done it).
Then you bring all that data into a Google Doc that you fancified to impress the readers of this marketing report. And by the time it’s all over, it’s time to start prepping for the next report. It feels like none of the data you presented was timely anyway, and then you really do need a nap.
Well, I’ve got news for you, fellow reporting laborer. Databox can solve at least some of those problems and make your report pretty, all at the same time.
Here’s what we’ll cover:
- How Databox Works
- Key Features
- Advanced Features
- Accessibility
- What Databox Is Good for
- What Databox Isn’t Good for
- How Our Agency Uses Databox
How Databox Works (hint: it’s magic)
Databox uses APIs to pull in data from various apps and deposit it all in one spot. They call this magical location a “Databoard”. You don't have to navigate to Google Analytics, Facebook Ads (slowest load time ever #amiright) and HubSpot just to get an update on your web traffic and lead performance. Databox has all that data waiting for you to gaze upon while sipping your morning coffee.
One thing to note, the data available in Databox is determined by what the data source makes available. The number of metrics and flexibility of what you can do with them varies by each platform. Most allow custom metrics, but some do not. And the kind of data you can pull from each one is completely determined by the data source’s API.
Key Features
Standard and Custom Digital Marketing Metrics
Each data source comes with a set of standard metrics. These will be common metrics used in the account, like clicks or views or time on site. If those don’t suit your needs, you can create custom metrics to pull the data you want. Again, this is limited by what the API allows you to do, but it’s still pretty capable.
Within custom metrics, you can filter the results and add date range options that will show up when you use the metric in a Databoard.
Here are some of the common sources you can connect to Databox:
- Google adwords
- Facebook Ads
- Google Search Console
- Google Analytics
- Email Marketing Platforms (like HubSpot and Mail Chimp)
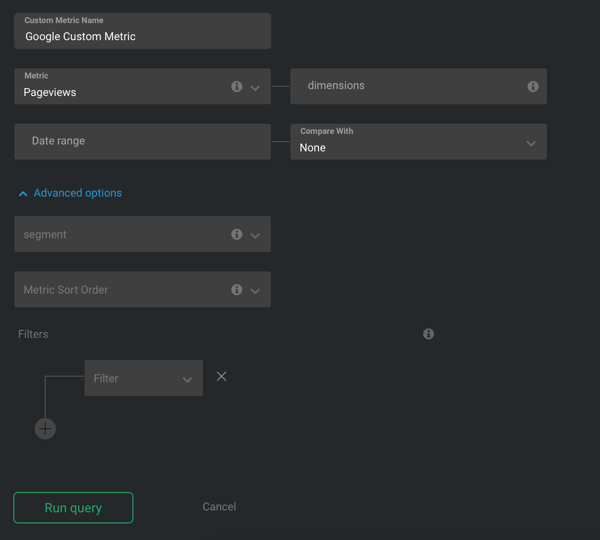
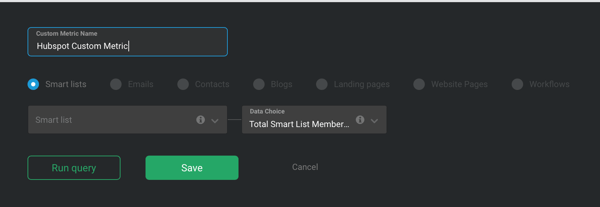
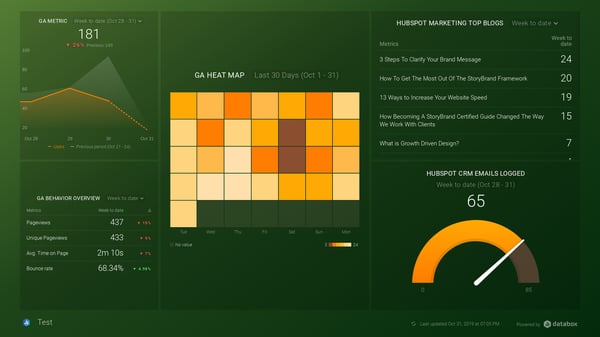
Below is an example of what it looks like when you go to create a custom metric. You can see the difference in what is available between two different data sources (Google Analytics and Hubspot CRM).
Data Visualizations (Fancify Your Marketing Reports)
Visualizations are options for displaying your data. You can choose from tables, graphs, funnels and more. Not all metrics are usable in every data visualization. This changes by platform and the metric being applied.
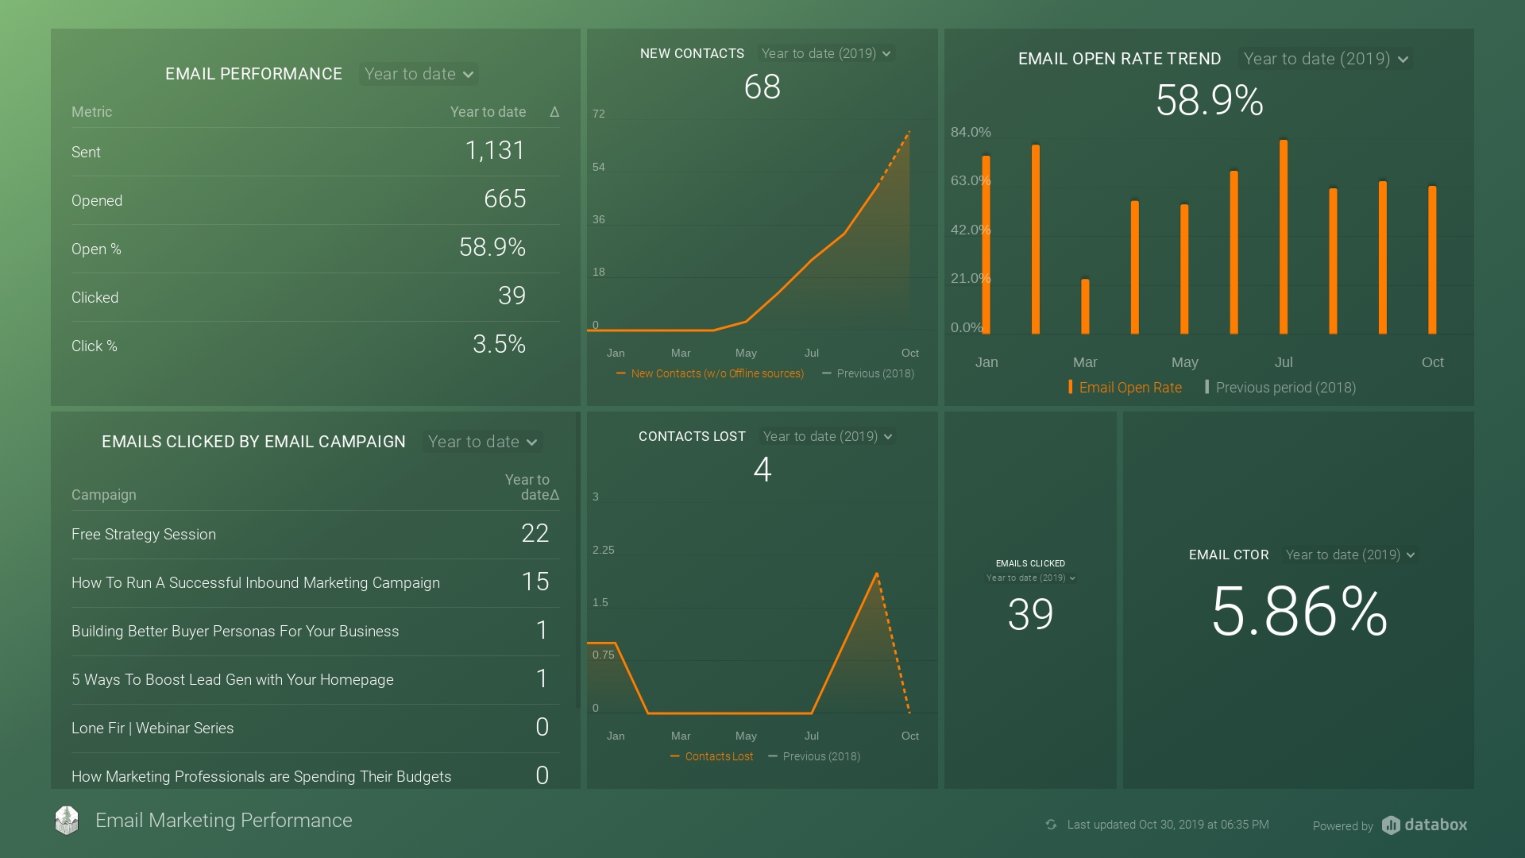
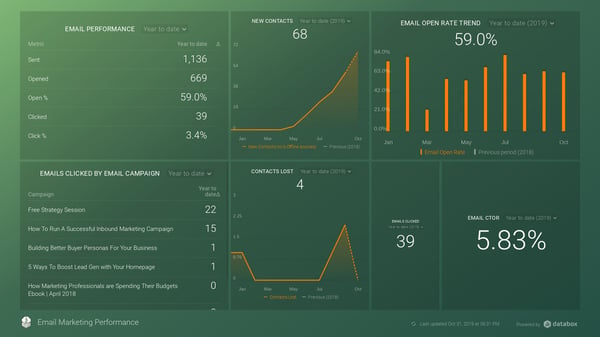
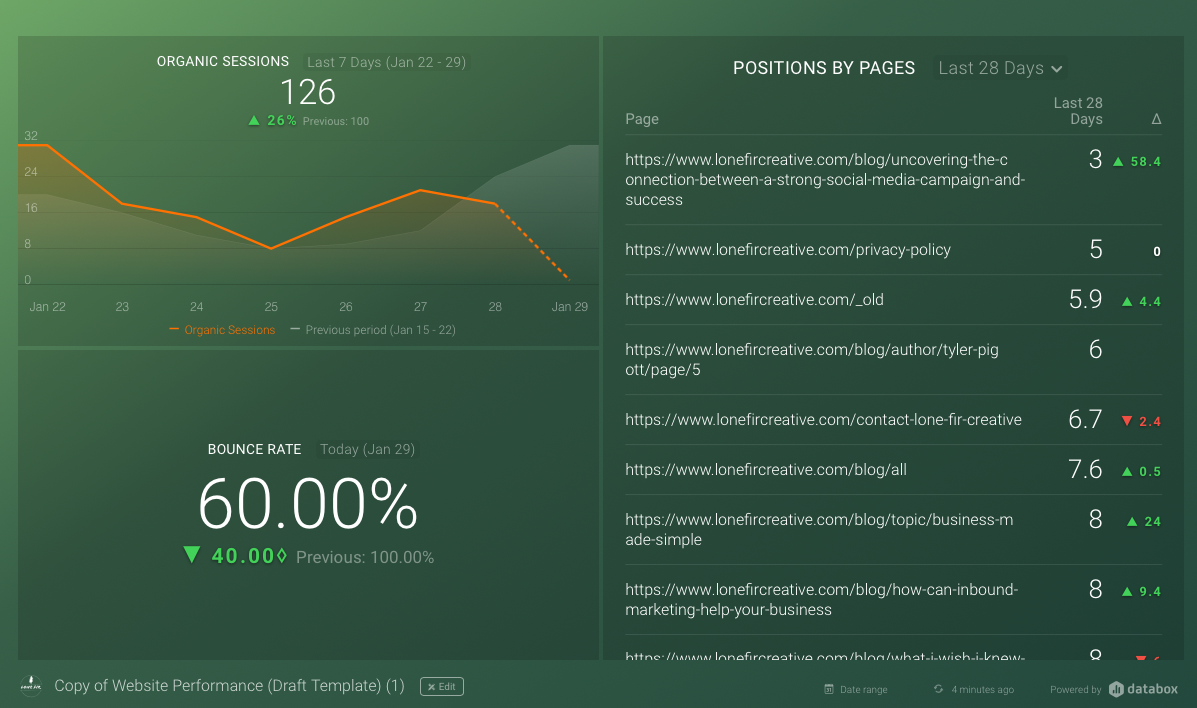
Check out this custom report we built to keep tabs on efforts to improve and convert organic traffic. It shows bounce rate, organic search traffic, and Google Search Console report that shows our keyword rankings.
Advanced Features
Databox offers several advanced capabilities for more niche requirements (read: for techie people).
Google Sheets
You can set up Databox to pull reporting from Google Sheets, turning those stuffy tables into beautifully digestible data.
Zapier
You can also connect zapier to databox. Let’s say you want to count the number of emails you’re getting from specific email addresses. You can do that with a Zap that is connected to Databox (I don’t know about you, but I think that’s pretty cool).
API Push
Send Databox data via an API.
SQL
Connect a SQL database to Databox and bring all that stuffy looking data to life with Databox’s beautiful interface.
Accessibility: All Your Reporting Tools in One Place
The whole point of Databox is to make your data more accessible, and they do it so. flipping. well. They have a super smooth app you can get on your phone and all your Databoards are automatically mobile friendly, so you can easily access your analytics dashboards anywhere.
They also provide a URL you can share with anyone so they can review the data. AND, if you have many Databoards, which you definitely will, you can set it up to contain all of them in that one link. That way, you can just scroll through them. It’s glorious.
What Databox Is Good For
In an ideal marketing wonderland, all our decisions would be informed by data. Which ad should we turn off? The data will tell us. Which campaign returned the best results? The data will tell us. Which page should we focus on improving? The data will tell us.
Data can tell us a lot and it can prevent us from making costly mistakes. The problem is, all our stuff is strewn across multiple platforms. And it takes time to pull it together and interpret it before making a decision. Because we live in a digital age, marketing and sales have become incredibly fast-paced. We need to have access to meaningful data when we need it.
Bringing Digital Marketing Data Platforms Together
Databox brings all your KPIs together into one, beautiful performance dashboard that you can access on your desktop or phone. From web analytics to PPC to the results of your lead generation campaign, you can see it all (and show your clients) in a custom report. The metrics from your data sources can sit side-by-side, giving you a complete view of your marketing activity and performance.
Daily Data
Databox provides an up-to-date (almost real-time) overview of where you’re at, and gives you the information you need to make informed decisions each day.
Detecting Problems Before They Become Fiascos
Having up-to-date data available to view whenever you want makes it easy to keep tabs on your sales and marketing performance. It also makes it obvious when something goes out of whack. Let’s be honest, technology isn’t perfect. It has hiccups, and sometimes we don’t find that a particular hiccup caused a minor avalanche until a few days after the fact. Seeing your data every day makes it easy to notice when something stops making sense. Whether that’s because the data itself is flawed, or because a piece of software is having issues, you’ll catch it.
TL;DR - The Good
- Almost real-time updates/monitoring
- Aggregating data sources together for side-by-side reporting
- Detecting problems before they become bigger problems
What Databox Is Not Good For
You may have read through this whole article and thought “Wow, Databox is basically magic.” And I totally get that sentiment. In some ways, it kinda is. But I have to be honest, it does have limitations.
First, let’s be honest with ourselves.
We don’t always do a good job of reporting on the right things or defining what “success” looks like. Because of that, our reporting turns into a mish-mash of metrics that look interesting and make us feel good. But the truth is, we aren't benefiting from seeing those metrics every day.
Here’s what we actually need to see daily:
- Key metrics and how they’re trending
- If something needs to be adjusted in our tactics
- If something has gone horribly wrong (or wonderfully right!).
Databox is great at fulfilling these daily needs, but it does have a few weaknesses that show up when you start pushing the boundaries of daily needs.
Weakness #1: In-Depth Sales and Marketing Analytics :(
Databox isn’t meant for in-depth reporting. If your company needs detailed, quarterly style reports, you'll need to supplement Databox with some reports of your own.
Weakness #2: Investigating Issues
If you need to troubleshoot a problem or find the reason behind a change in metrics, you’ll need to spend some time diving into the data on the native platform. Ultimately, the source of the data is going to give you the most flexibility in analyzing and cross-referencing.
TL;DR - The “Not-As-Good-But-We-Still-Like-Databox”
- Not the tool for in-depth reporting
- Not the place to diagnose/troubleshoot an issue
How Our Digital Marketing Agency Uses Databox
At Lone Fir, we use Databox to give our clients a window into their data, anytime they want to see it. It’s a way we follow through on our commitment to being transparent about our performance. The metrics we are tracking don’t change unless we all decide that tracking a different metric makes sense. Since our clients have access to their own digital marketing dashboard that keeps track of our performance, it’s easier for them to trust that we’re not hiding anything from them.
Plus, other people in their company will inevitably ask about this or that, and with Databox they can often just pull the numbers up without having to ask us for them. It’s great for everyone.
Use Databox's Digital Marketing Reports as a Foundation for Your Meetings
Our goal with Databox is to run our regular update meetings off of the client’s Databoards. We pull them up at the start of the meeting, discuss what the numbers imply and then strategize based on our findings. We do this with some of our clients and it’s working great. But the truth is, not every client is at the place where they can run like this. To use reporting in every meeting, it’s necessary to is agree on a philosophy of reporting that makes sense to everyone. Here are some items you’ll want to check off before running headlong into the magic of Databox:
- Get all your decision makers to agree on what you want to accomplish with your reporting.
- Agree on key, trackable, metrics that will demonstrate your performance.
- Benchmark where you are and set a reasonable goal for improvement.
Did That Answer All the Questions You’ve Ever Had About Databox?
If I’m being honest, the nerd in me gets a little spark of happiness every time I open up a freshly finished Databoard and see all the pretty graphs and organized numbers and...well, you get the idea. If you need help setting up your Databoards so you can experience that same little spark of joy, let us know. We’d love to help.